
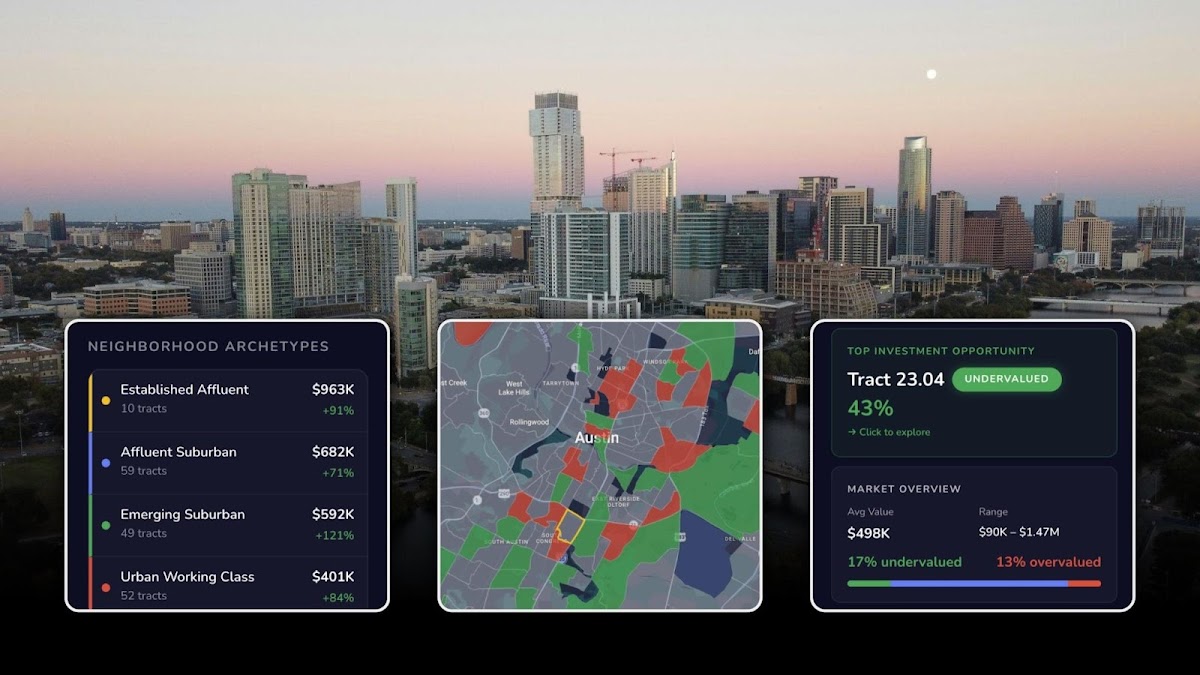

Editor’s note:Today’s blog post comes from Topher Lund, Customer Engineer at Navagis. In this blog, he shares an evolution of Navagis’ previous research in Japan, conducting a new machine learning analysis in Austin to quantify how the quality of a neighborhood’s commercial ecosystem can uncover hidden real estate investment opportunities.
In real estate acquisition, development, and asset management, relying on historical property records and static demographic spreadsheets is a recipe for missed opportunities and capital misallocation. While traditional datasets like demographic data and crime statistics provide baseline context, they fail to capture the evolving economic momentum and lifestyle desirability of a neighborhood. To uncover undervalued residential growth corridors before the competition—and accurately price real estate risk—investors need a dynamic, comprehensive picture of a neighborhood’s commercial and social fabric.
Previously, Navagis demonstrated this by analyzing how proximity to local amenities impacted land prices in Tokyo and Yokkaichi. As an evolution of that previous project and analysis, we recently shifted focus to the dynamic real estate market of Austin, Texas. By using Google Maps Platform’s high quality Places Insights dataset in BigQuery,–an analysis-ready point of interest (POI) dataset purpose-built for analyzing commercial density–we deployed a machine learning model that successfully accounted for 85.9% of home value variation across Austin’s census tracts.
By securely combining Places Insight’s monthly-refreshed aggregated POI intelligence with public datasets directly within BigQuery, the study revealed that analyzing the specific quality of a neighborhood’s businesses provides quantifiable indicators about home values that no other publicly available dataset can replicate. One of the most powerful aspects of Places Insights is that there is nothing to build or import. Rather than sourcing raw, unaggregated POI data from multiple regional vendors—which requires high overhead of data preparation and alignment—analysts can deploy a unified, pre-aggregated analytical dataset across 50 supported countries. The data is delivered natively in BigQuery, landing directly alongside your own tables and ready to use. Once a subscription is active, anyone with access to your project can start querying over 300 million places with no pipelines, no file transfers, and no ongoing infrastructure overhead.
Bringing global data to the local evel
To build a complete, actionable profile of the Austin market, we trained a linear regression model directly using BigQuery ML. A key advantage of this approach is that the entire analysis ran in BigQuery on Google Cloud using standard SQL with no data exports, no separate tooling, and no infrastructure to manage. After subscribing to the Places Insights dataset, we used BigQuery’s built-in geospatial functions (like ST_WITHIN and ST_DWITHIN) to match each…
Read More: A geospatial analysis with Places Insights in BigQuery – Google Maps
