


October 28, 2020

National affordability
Home ownership affordability declined in July as home prices continued to push higher in the United States, according
to the Federal Reserve Bank of Atlanta’s Home Ownership Affordability Monitor (HOAM) index. Despite historically low interest
rates, higher home prices and the continued strain on earnings during the COVID-19 pandemic continue to make it
difficult for a household earning an average income to afford to own a home.
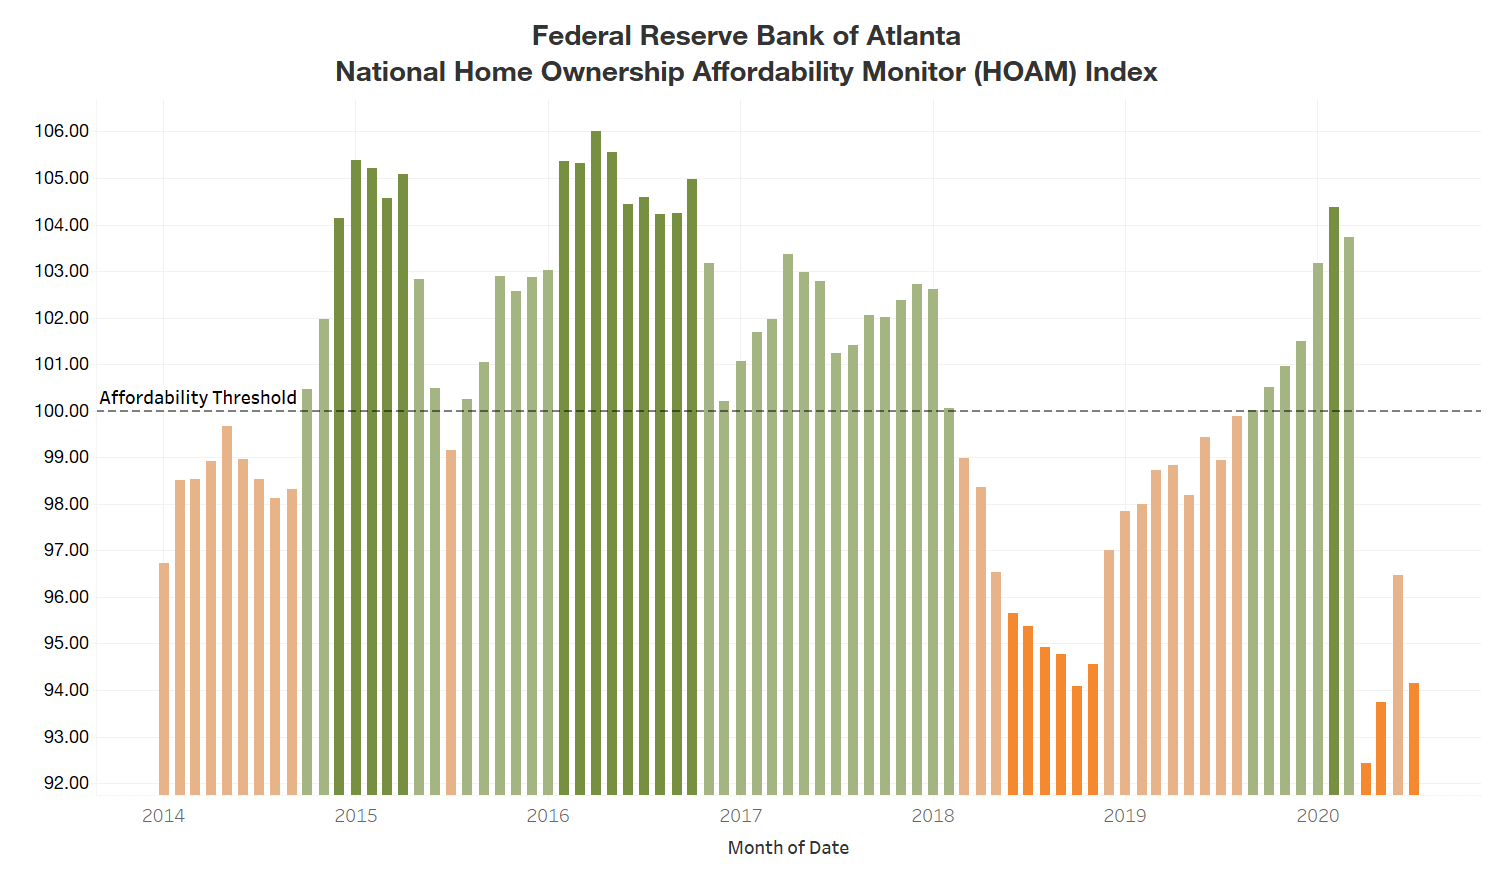
A HOAM index below 100 indicates that the median-priced home is unaffordable to the median-income household given the
current interest rate. In July, the HOAM index dropped to 94.1 from a revised 96.5 in June, indicating that the
median-priced home remained too expensive for the median-income household. The HOAM index was below its 98.9 reading
a year earlier. Home ownership costs in July (as measured by principal and interest, taxes, and insurance) accounted
for 31.9 percent of the annual median income of U.S. households, which is above the 30 percent affordability
threshold set by the U.S. Department of Housing and Urban Development. July marked the fourth month in a row that
the national HOAM index was below 100.
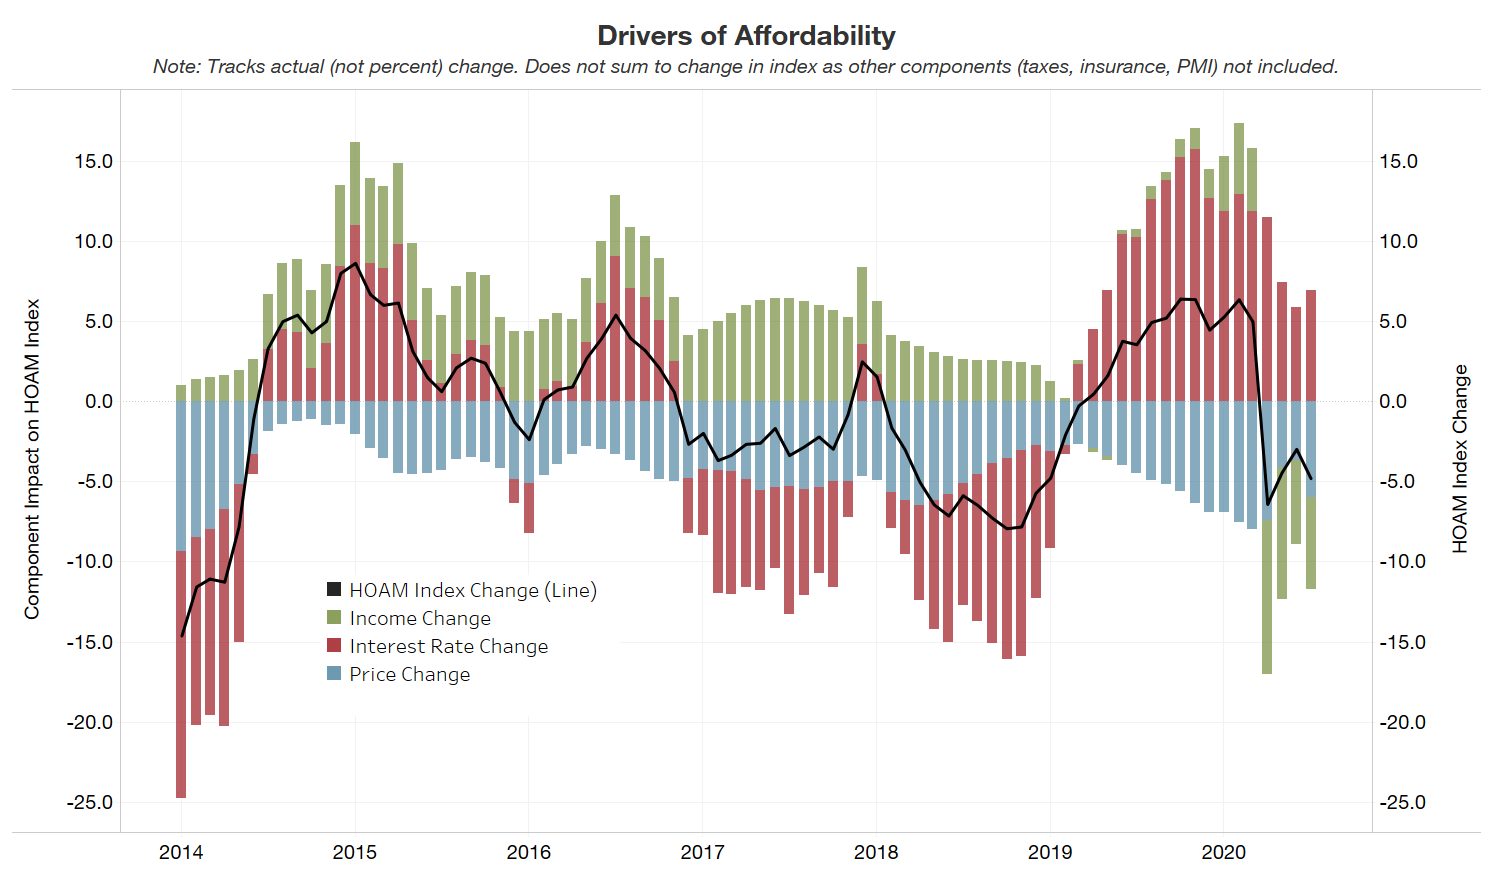
The 30-year fixed mortgage interest rate ended the month of July at 3 percent, a drop of 1.4 basis points (bp) from
June and a 20 bp decline from July 2019. The estimated median household income in the United States was $59,315 in
July, down 4.9 percent from a year earlier, as a result of the continued strain on incomes from the COVID-19
pandemic. Meanwhile, the national median existing home price (three-month moving average) rose to $289,844 in July,
up 4.5 percent to from a revised $277,344 for June. The latest price represented an 8.4 percent jump from a year
ago. Prolonged inventory shortages in many markets are exerting upward pressure on home prices, which reached record
levels nationally in July.
Regional affordability
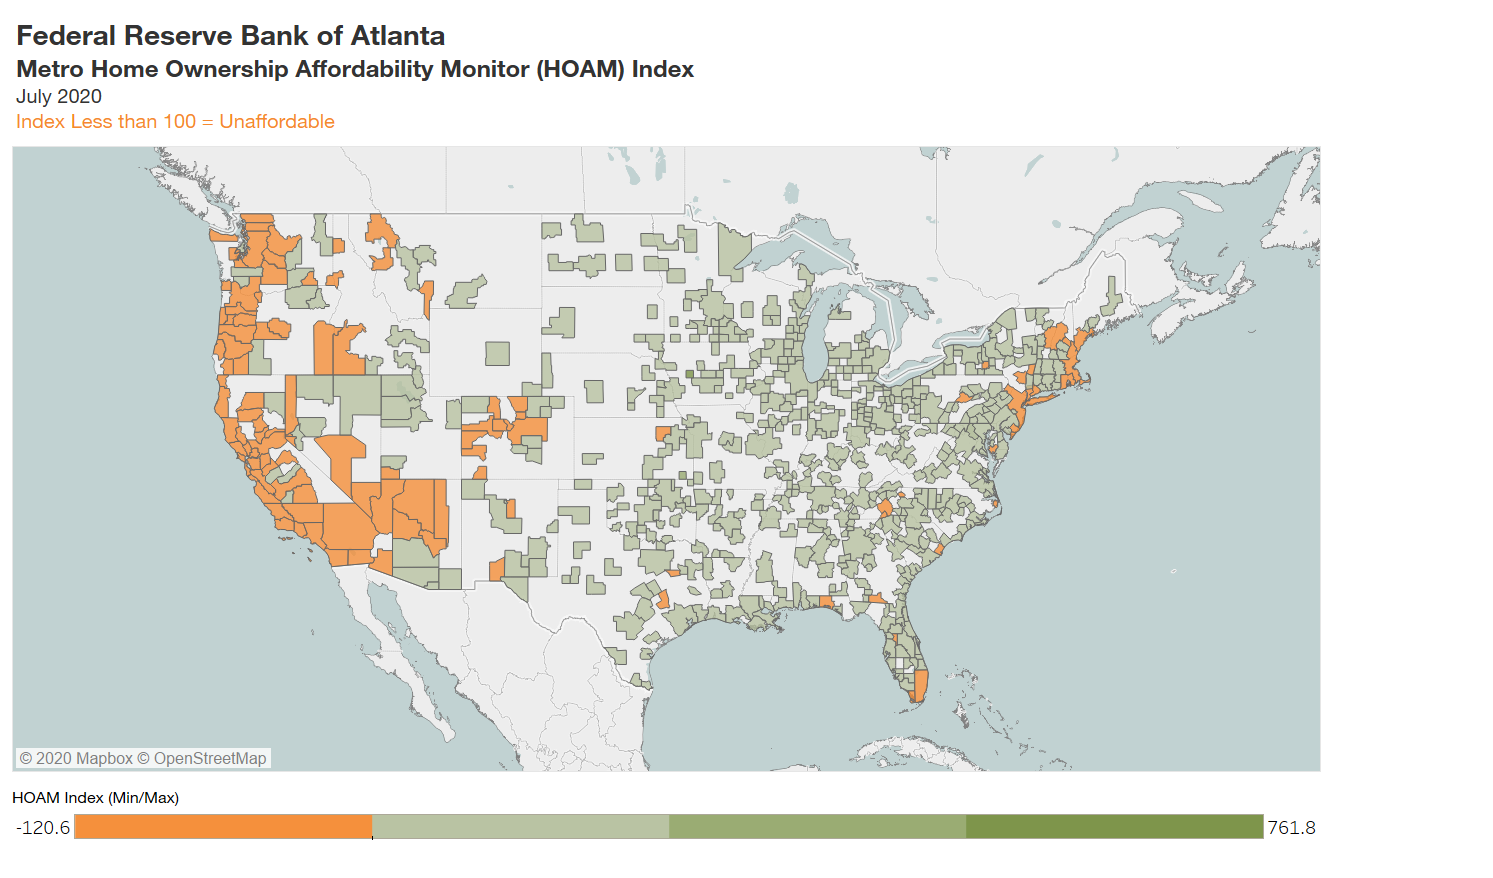
Eighteen percent of metro areas in the United States had a HOAM index below 100 in July, indicating that they were
unaffordable to median-income households. By contrast, a clear majority of metro areas—82 percent—had an
index above 100 and were considered affordable. Even so, affordability fell in 46 percent of metro areas from June
to July as rising home prices and lower household incomes took their toll. In general, high-cost metro areas on the
West Coast as well as in the Northeast and South Florida were among the least affordable, while metros in the middle
of the country, particularly in the Midwest, tended to be the most affordable.
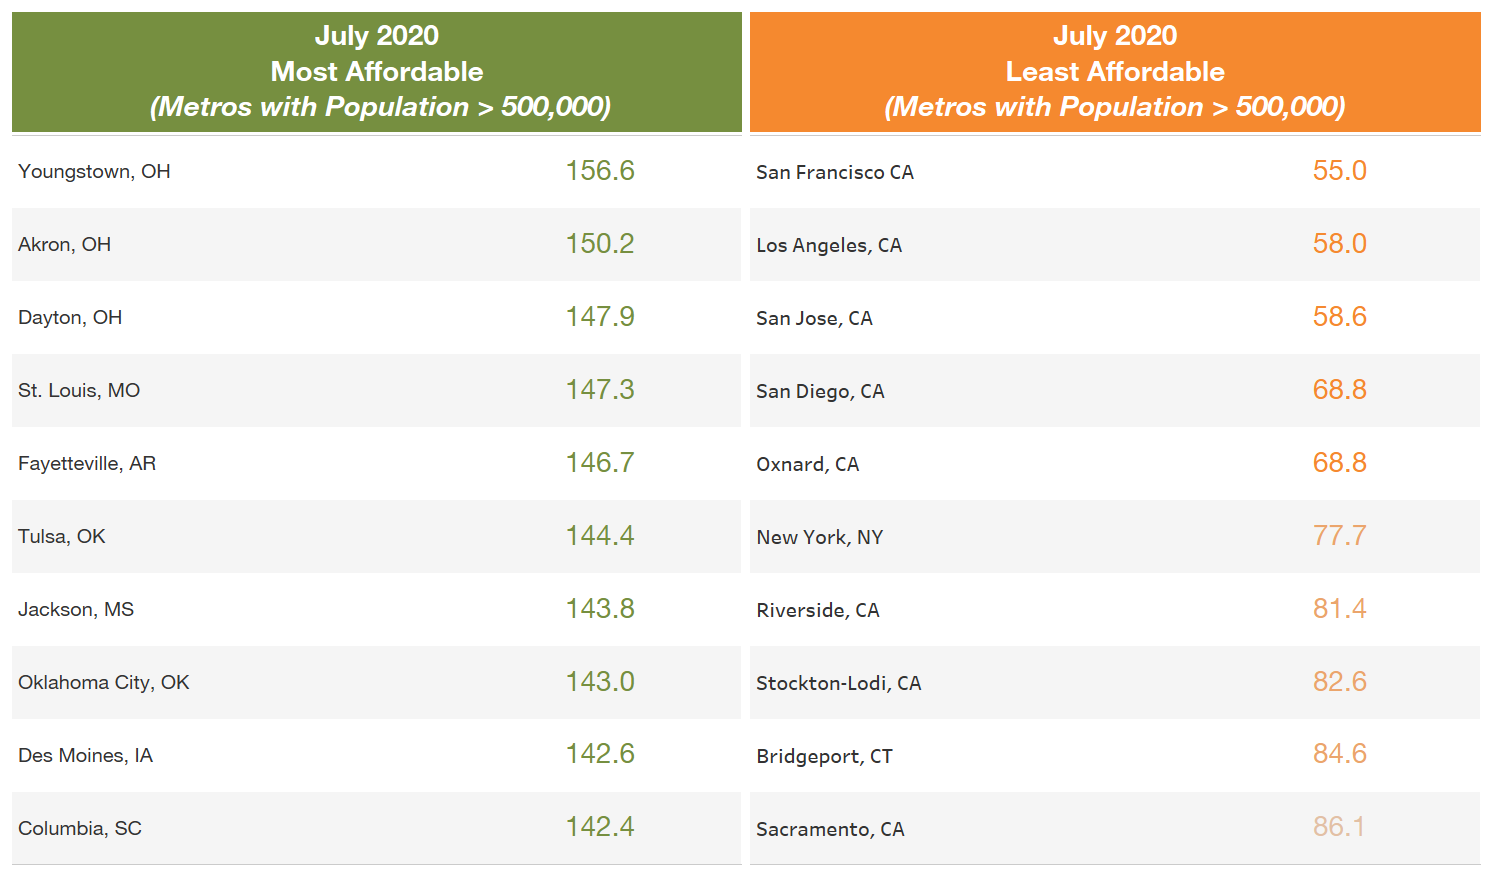
Among the nation’s largest metro areas (those with populations greater than 500,000), San Jose-Sunnyvale-Santa…
Read More: Home Ownership Affordability Monitor Update: October 2020
